The ‘Feels of Brunswick’ Data Visualisation. Image: Suzanne Phoenix.
This series of data visualisations were created from what we gathered through our community online survey ‘What makes Brunswick, Brunswick?’ that was completed by 237 people. While not limited to Brunswick residents, the survey reached 151 people who live in Brunswick, and another 38 who have previously lived or worked in Brunswick. The survey was principally promoted via Instagram, which means that most respondents fell within the age group of 18-29 years. In line with common trends within qualitative research, 146 of the respondents identified as female, 48 identified as male, with 11 identifying as gender diverse, and 32 preferring not to say.
The ‘Sights of Brunswick’ Data Visualisation.
What is the most Brunswick thing you have ever seen?
The ‘Sounds of Brunswick’ Data Visualisation.
What is your favourite Brunswick sound, and where do you hear it most often?
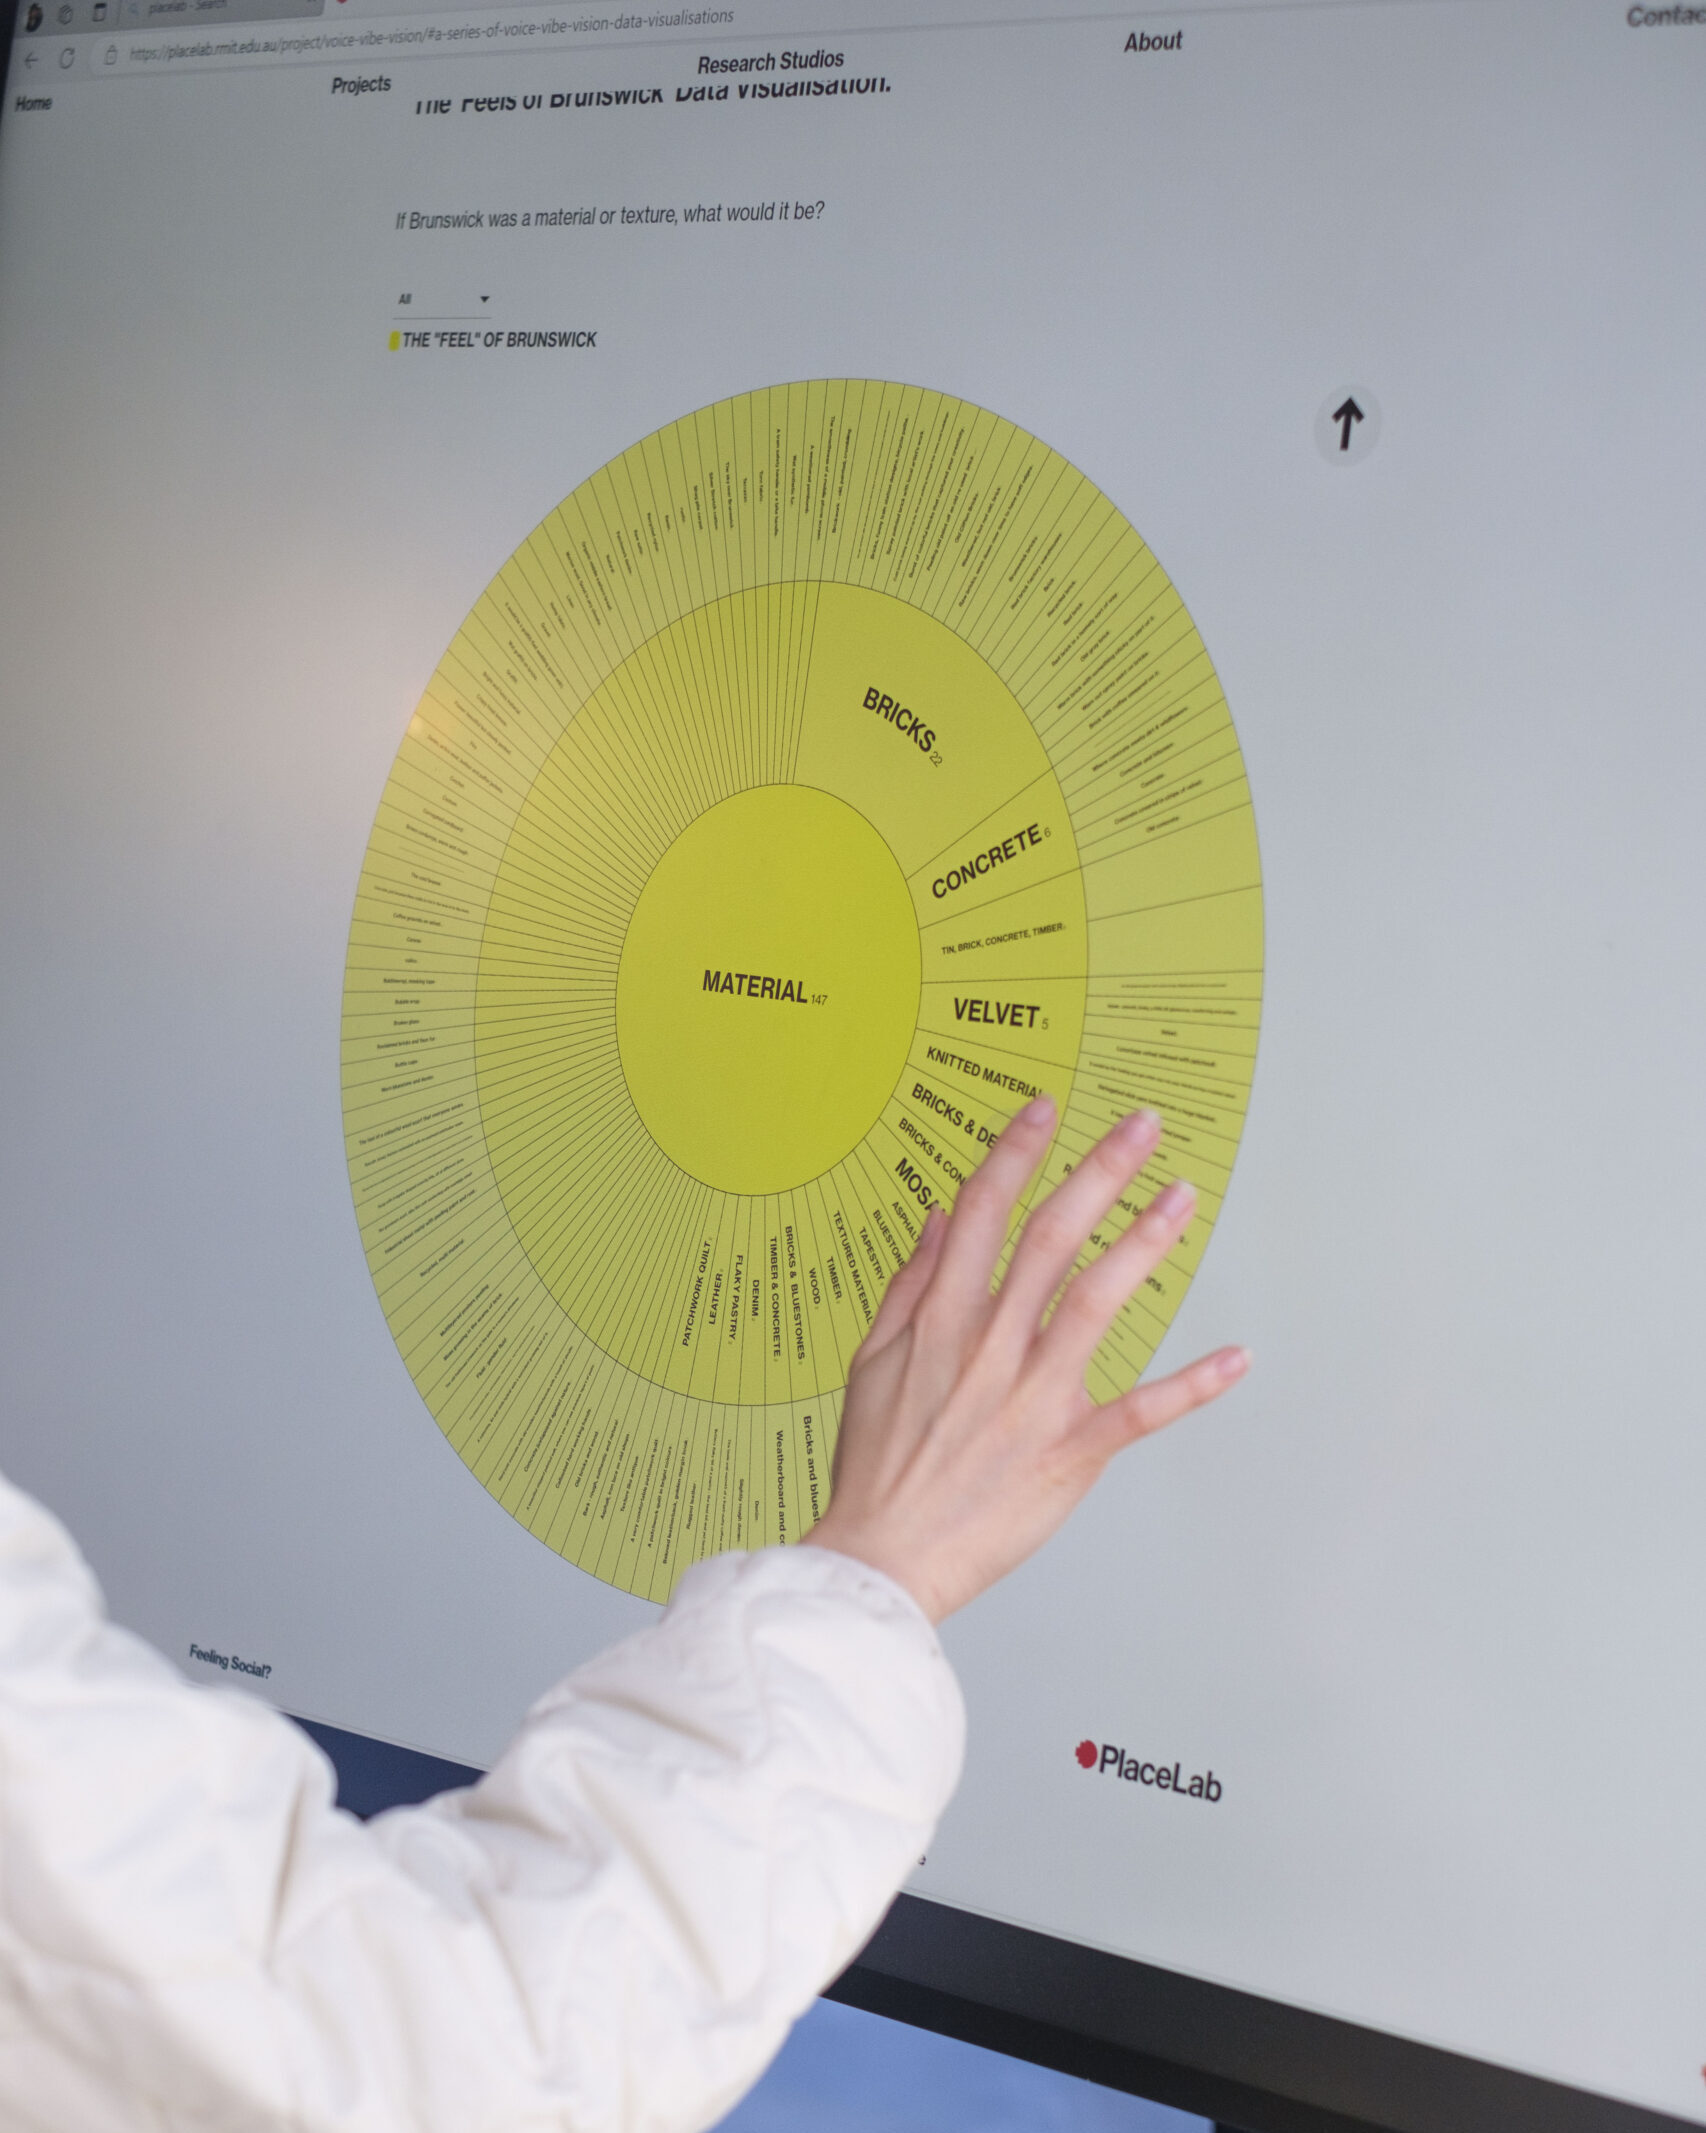
The ‘Feels of Brunswick’ Data Visualisation.
If Brunswick was a material or texture, what would it be?
The ‘Smells of Brunswick’ Data Visualisation.
Is there a particular smell that always ‘brings you back’ to Brunswick?
The ‘Tastes of Brunswick’ Data Visualisation.
What is the fashion or lifestyle staple of Brunswick?
The ‘Sites of Brunswick’ Data Visualisation.
Is there a spot in Brunswick that captures something special about the area?
The ‘Happenings in Brunswick’ Data Visualisation.
What event, ritual or goings-on in Brunswick has special significance to you and your community?
The ‘Brunswick is…’ Data Visualisation.
What is it, do you think, that makes Brunswick, Brunswick?
What makes up its character, its vibe?
Could you describe it in a short sentence?